
QlikView Metadata Extraction
Automated Metadata Extraction
QlikView was a very good product in analytics. It has been developing so well and now is going to fade out in the market. QlikView is now having very few updates and minimal support. A lot of companies are planning to migrate QlikView applications to Qlik Sense applications or other analytic tools like Tableau or PowerBI.
In order to perform the migration, apparently, it is not an apple-to-apple. No matter on design or the end-to-end data flow, there will be differences. Thus, to increase the successful conversion, there is a need to extract the metadata in QlikView. Instead of browsing all details in the QV applications, extracting the metadata will make it easier to understand the applications and design.
This article is going to share the automatic method to extract the metadata. And I will also share some ideas on how to use this metadata.
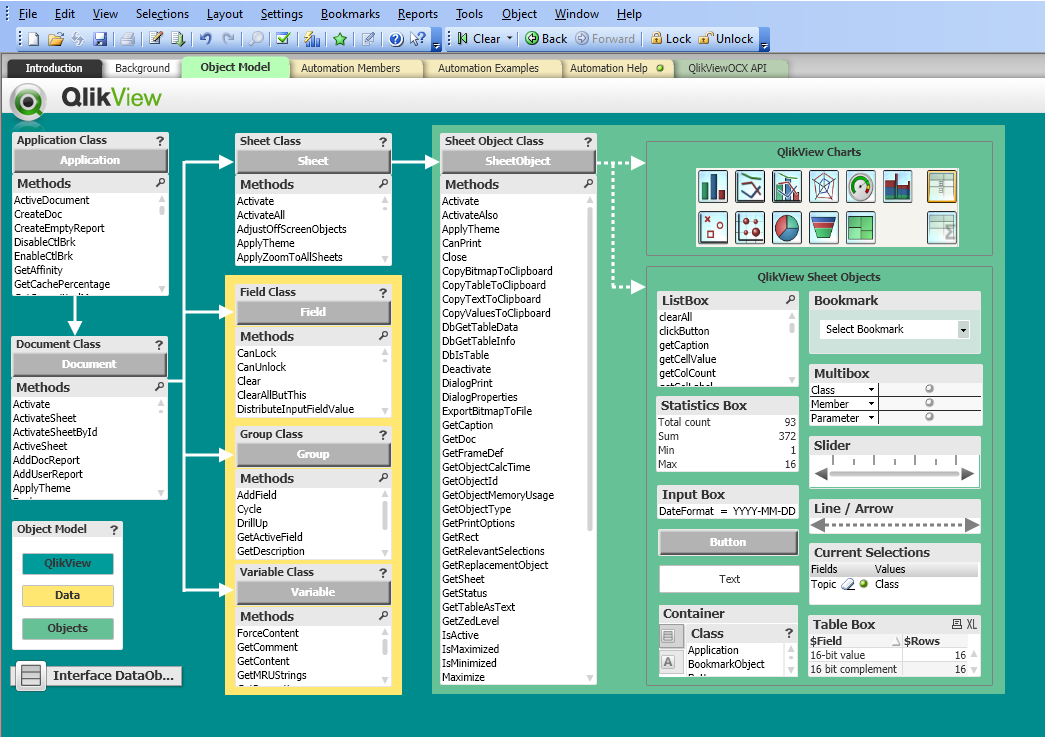
QlikView COM API
In QlikView, there are a tool called QlikView COM API. It is available to be used for automation and macros. It can also be used in creating standalone Windows applications with its OCX component. The QlikView COM API reference can be found here.
After downloading and unzip, there is a QVW application to illustrate all the API available.
Important Metadata
In general, two kinds of metadata are required:
1. Layout file
It contains all the QV properties in the application. Apart from calling API, in fact, this can also be extracted via the front-end (* this will separate all individual components per XML file)

2. Variables
There are plenty of ways to extract variables. For example, people might write script to get the values of each variables and put into a table, then export the details into csv. In order to from metadata level, API can be used.
With both the XMLs and variables, it is very easy to trace the expression used in each chart. And further analysis can be done to review how they can be implemented in other analytic tools.
In the QlikView COM API Guide application, there is a sheet named "Automation Members" to review the parameters of each method.

And there is a sheet "Automation Examples" that illustrates an example of the API call.

Using the QlikView COM API
The metadata extraction pseudo steps are described as below.
1. Define the paths, e.g. QV doc path, layout folder path, variables.csv path.
2. Create the QlikView object.
3. Open the QV document.
4. Export the layout files.
5. Get the variable list
6. Loop through the variable list and construct a format for csv output
7. Close and clean up the resources.
In order to use the API, VB script can be used. The complete VB script is as follow.
'Paths
dim qvDocName, layoutFilePath
qvDocName= "D:\qv.qvw"
layoutFilePath= "D:\layout\layout.xml"
variableCSVPath= "D:\variables.csv"
'Create QV object
set qv = CreateObject("QlikTech.QlikView")
'Open QV doc
set qvDoc = qv.OpenDocEx (qvDocName, 2 , false , "" , "", "" , false)
' Export Layout Files
qvDoc.ExportLayoutFile(layoutFilePath)
' For variable CSV output
Set objFSO = CreateObject("Scripting.FileSystemObject")
CONST ForWriting = 2
'Open the CSV file for writing
Set objTextFile = objFSO.OpenTextFile (variableCSVPath, ForWriting, True, -1)
'CSV header line
objTextFile.WriteLine("VariableName|||VariableValue|||RawVariableValue|||")
Set vars = qvDoc.GetVariableDescriptions
for i = 0 to vars.Count - 1
set v = vars.Item(i)
' using ||| as delimit will be easier to avoid the newline and quote issues in CSV during read.
objTextFile.WriteLine(v.Name &" |||")
objTextFile.WriteLine(qvDoc.GetVariable(v.Name).GetContent.String &" |||")
objTextFile.WriteLine(v.RawValue &" |||")
next
objTextFile.Close
qvDoc.CloseDoc
qv.Quit
Parsing the XML and Variables
The XML is well formatted and it contains all the properties of all charts, sheets, texts, etc. To be simple, the most important are charts, dimension and measures. By extracting these from the XML, it can have a basic ideas of the complexity of the application.
Usually, in the expression, a lot of variables will be used and more often, they are nested. It is not easy to trace them level by level because there is a lot of back-and-forth to review each step. In QlikView, dollar sign expansion is used to get the value of the variables. With this understanding, it is possible to use $(variablesName) as a mapping to match the value from the variable list extracted. In such a way, the variable used in each chart can be expressed in the most detailed format where all variables are extracted.
Although this cannot resolve dynamic variables, to certain extent, it helps a lot in digesting the information in QV. This article would not cover the extraction part. But in case if you think it is interesting, do drop me a message and I will see if a guide can be provided later.
Thank you for reading. I hope you like the sharing. Leave me message and let me know what you think.
* If you like my post, support me buy me coffee https://buymeacoffee.com/kongsoncheung.