Technical Discussion | Analytical Calendar The Story | The Index Page
Analytical Calendar
Public Release
Analytical Calendar is continuing its journey with many versions developed with different forms and attempts that aims at reducing the development effort and boost the overall experience in data analytics. Each version has its own pros and cons but after a lot of effort, I am now trying to release a public version that I think that is easy enough for everybody.
Analytical Calendar - Public Release for 2022 to 2026
The QVD files can be found in:
2. DIM_CALENDAR
Just load them into your dashboard and make sure you have a fact table with %DATE_KEY to associate to the analytical calendar.
In general, you will just need two similar expressions:
1. analysis period, sum({<[Comparison Perspective]={'N/A'}>} Exp1)
2. comparison period, sum(Exp1)
Analytical Calendar Review
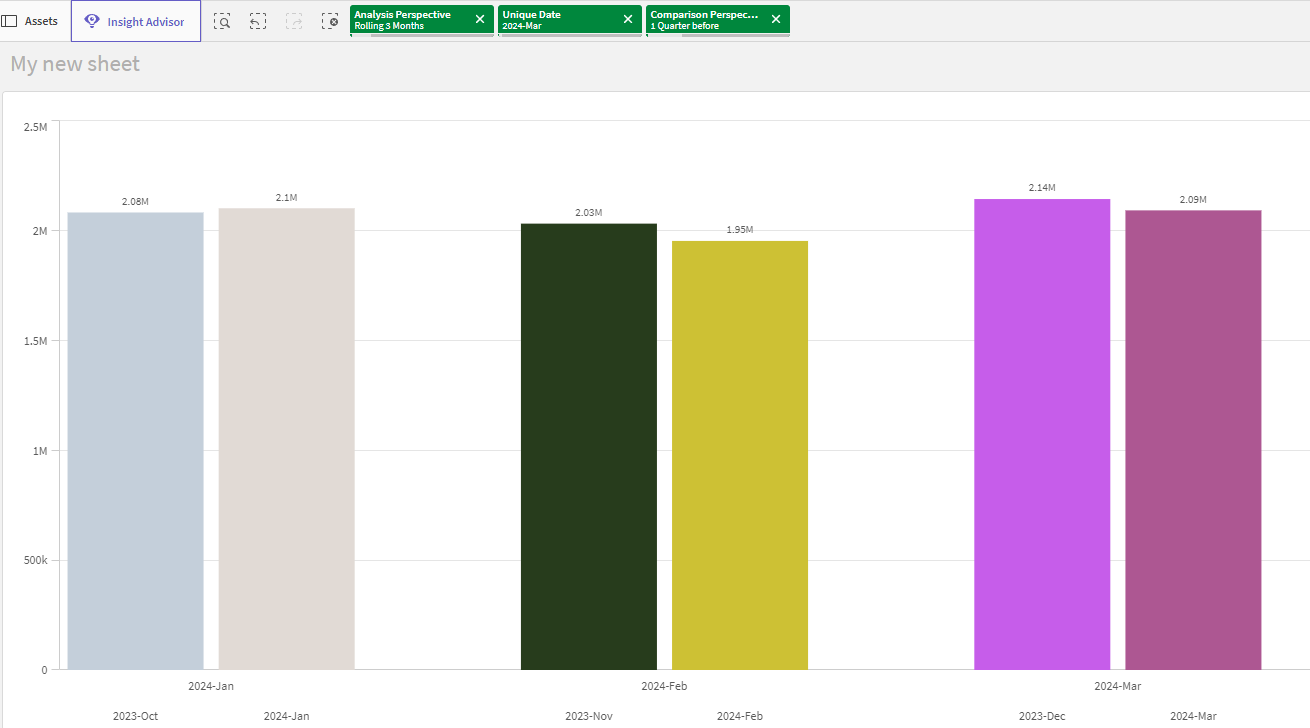
Instead of selecting year, month or day, analytical calendar requires you to select three basic fields including:
1. Analysis Perspective
i.e. in what time analysis you want to perform, e.g. year? Year month? Date? YTD? YTM? rolling?
2. Unique Date
i.e. Which date? e.g. 2025 (for Year granularity), 2025-Q1 (for quarter granularity), etc.
3. Comparison Perspective
i.e. the comparison regarding to the analysis period, e.g. 1 Year before, 2 months before, etc.
Analytical Calendar Configuration
It covers 5 years of data with period from 2022-01-01 to 2026-12-31 with 5 level of granularity including Year, Year Quarter, Year Month, Year Week and Date.
And it has the following analysis perspective and comparison perspective:
- Analysis Perspective
- Year
- Rolling Year (2 - 3 years)
- Quarter
- Year to Quarter
- Rolling Quarter (2 - 3 quarters)
- Month
- Year to Month
- Rolling Month (2 - 11 months)
- Week
- Year to Week
- Rolling Week (2 - 26 weeks)
- Date
- Year to Date
- Month to Date
- Rolling Day (2 - 30 days)
- Comparison Perspective
- Comparison Year Before (1 - 3 years)
- Comparison Quarter Before (1 - 3 quarters)
- Comparison Month Before (1 - 11 months)
- Comparison Week Before (1 - 26 weeks)
- Comparison Day Before (1 - 30 days)
- Comparison - N/A