Technical Discussion | Analytical Calendar The Story | The Index Page
Analytical Calendar
New Update
Analytical Calendar has been enhancing and it hopes to help analytics becoming simpler, more standard and allowing both developers and analytic users to take advantages over it for its generic and harmony design of using date for analysis and comparison.
For analytic users, it does not require to bear the burden of date manipulation because the selection and the visualization are already integrated very well together to bring along the effect of what you select is what you get. Although, it needs to first understand the concept, it is fairly easy to ride on.
For developers, it does not require to write a number of expressions for different date requirements and avoids creating plenty of similar charts to achieve different date granularity to make overall design neat and focused. The development is shortened so that more effort can be put into the visualization for best analytic purposes.
Today, this article focuses on the description of the new version of analytical calendar on two areas:
1. two tables design
2. comparison group is added
Two Tables Design Analytical Calendar
Analytical calendar has been enhancing along the time. In the previous version, it requires 3 core fields to control over the analysis period and comparison period that includes:
- Analysis Perspective
- Unique Date
- Comparison Perspective
These three fields intelligently help you deal with all complicated calculations in the backend and avoid confusion when dealing with impossible date component combinations.
In the previous design, it has three core tables:
- Analytical Calendar (ANALYTICAL_CALENDAR)
- Date Range Linked Table (DATE_RANGE_LINKED_TABLE)
- Date Dimension (DIM_CALENDAR)
In majority of the time, a number of people might not be familiar with the operation of linked table. Thus, the latest version combines the linked table and analytic calendar into a single analytical calendar table as below:
The disadvantage is that the ANALYTICAL_CALENDAR will become larger with more rows but it is still manageable with modern server resources. The advantage is that is does not required to manage the linked table which is a bit difficult to understand without technical knowledge.
With this model design, the functionality and everything remains the same.
Comparison Group
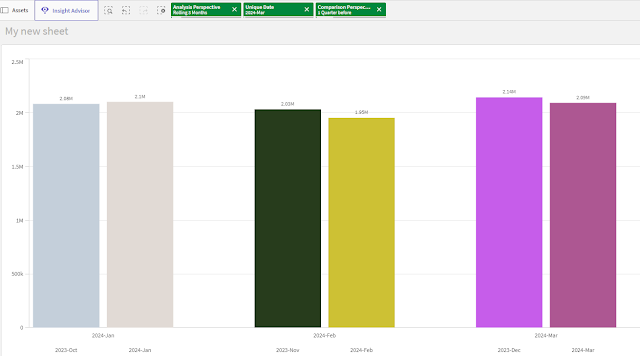
If your eyes are good enough, you might notice a new field "Comparison Group" is introduced in the ANALYTICAL_CALENDAR table. It is a new function for comparison visualization. To understand it, let use an example. For instance, the selection of the 3 core fields are:- Analysis Perspective (Rolling 3 months)
- Unique Date (2024-Mar)
- Comparison Perspective (1 Quarter before)
The analysis period 2024-Jan to 2024-Mar has three individual year month including 2024-Jan, 2024-Feb and 2024-Mar while the comparison period has individual year month including 2023-Oct, 2023-Nov and 2023-Dec. The comparison group helps to group these period together. As a result, you are able to compare in detail which year month is performing good or bad inside the analysis and comparison period.


No comments:
Post a Comment