Saturday, April 20, 2024

Analytical Calendar in Google Drive

 Post Index

Analytical Calendar The Story

2024-04-20

Analytical Calendar in Google Drive

Data File Sharing and How to Use

Analytical Calendar (Default Mode) from 2015 to 2024


This post is to provide you a step by step guide on how to integrate the analytical calendar into your analytic dashboard.  The analytical calendar files are now available in Google Drive (Please send me a request and I will share you the files).

The Analytical Calendar consists of the following information:

1. It has calendar information from 2015-01-01 to 2024-12-31.

2. It has date granularity of Year, Quarter, Month, Week and Date.

3. Week is using Complete Week concept.

4. Analysis Perspective include:

    a) For Year

        i) Actual Year

        ii) Rolling 2, 3 Years

    b) For Quarter

        i) Actual Quarter

        ii) Year to Quarter

        iii) Rolling 2, 3 Quarters

    c) For Month

        i) Actual Month

        ii) Year to Month

        iii) Rolling 2 - 11 Months

    d) For Week

        i) Actual Week

        ii) Year to Week

        iii) Rolling 2 - 26 Weeks

    e) For Date

        i) Actual Date

        ii) Year to Date

        iii) Year to Month

        iv) Rolling 2 to 30 Days

5. Unique Date include:

    a) Year from 2015 to 2024

    b) Quarter from 2015-Q1 to 2024-Q4

    c) Month from 2015-Jan to 2024-Dec

    d) Week from 2015-W2 to 2024-W53

    e) Date from 2015-01-01 to 2024-12-31

6. Comparison Perspective include:

    a) N/A

    b) For Year

        i) From 1 to 3 Years before

    c) For Quarter

        i) From 1 to 3 Years before

        ii) From 1 to 3 Quarters before

    d) For Month

        i) From 1 to 3 Years before

        ii) From 1 to 3 Quarters before

        iii) From 1 to 11 Months before

    e) For Week

        i) From 1 to 3 Years before

        ii) From 1 to 26 Weeks before

    f) For Date

        i) From 1 to 3 Years before

        ii) From 1 to 3 Quarters before

        iii) From 1 to 11 Months before

        iv) From 1 to 26 Weeks before

        v) From 1 to 30 Days before

7. It might have more than required calendar information and that can be filtered.  It will be demonstrated how to do.


Step by Step Guide

In Qlik SaaS, create a new application or use the application that you would like to use the Analytical Calendar.  And then go to Data Load Editor to begin.


1. Click "Create New Connection".


2. Click "Google Drive".

3. Click "Authenticate".


4. Enter the Gmail account.


5. Enter the password.


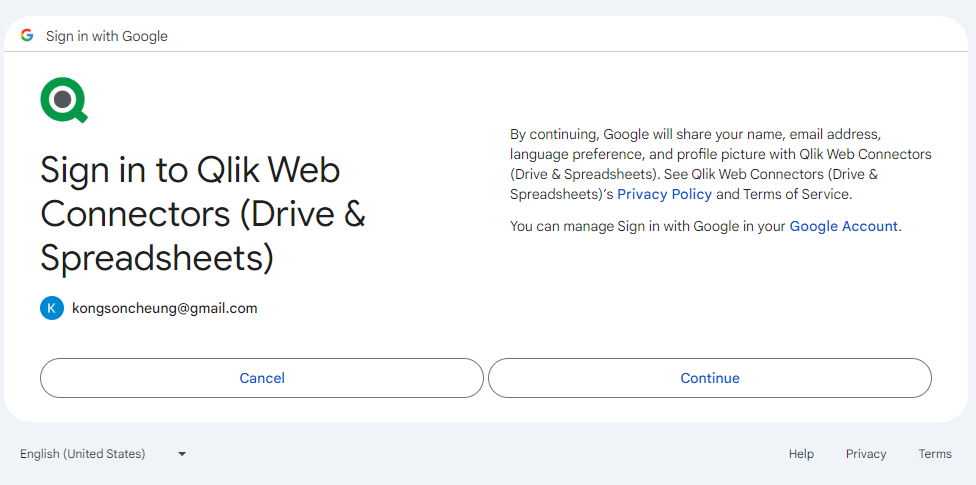
6. Click "Continue".


7. Click "Allow".


8. Click "Copy to Clipboard".


9. Paste the link and click "Verify".


10. Update the Name and click "Test Connection".


11. Click "Close".


12. Click "Create".


13. Click the folder icon under the newly created connection.


14. Select the Analytical Calendar file and click "Select".


15. Wait.

16. Do the same for Date Range Linked Table.  Select the file and click "Select". 


17. Do the same for Date Dimension.  Select the file and click "Select". 


18. Modify the script.

a) Add the Table Name.

b) In ANALYTICAL_CALENDAR, add the where clause 

    Where left([Unique Date], 4) >= 'YYYY' (YYYY is between 2015 to 2024)

c) In DATE_RANGE_LINKED_TABLE, add the where clause 

    Where exists(%DATE_RANGE_KEY)

    and [%DATE_KEY] >= 'YYYY-MM-DD' (YYYY-MM-DD is between 2015-01-01 to 2024-12-31)

d) In DATE_DIMENSION, add the where clause 

    Where exists(%DATE_KEY)

All these will eliminate the unnecessary data.


19.  Click "Load Data".


20. Enjoy using the Analytical Calendar !!


Conclusion

It is a no cost sharing.  Very Simple and can let you enjoy the advantages of the Analytical Calendar.   The settings are default and definitely can be customized for specific usage.  If there is a demand, it would later enhance the overall distribution method to really help contribute to the Analytics realm.  For the time being, have a try and let me know if you have any feedback.  The calendar has been developing for quite some time and keep evolving based on the your comments.


Thank you!!  I hope you enjoy the reading and sharing.


Saturday, March 30, 2024

Saturday, March 23, 2024

Analytical Calendar - Simplification

Post Index

Analytical Calendar The Story

2024-03-23

Analytical Calendar

Simplification

Enhancement Based on Use Feedback


Analytical Calendar is very simple to use with the sequence to select:

1. Date Perspective to select the date granularity

2. Unique Date to select the date for analysis

3. Analysis Perspective to select the date range

4. Comparison period to select the date range for comparison.  

Logically speaking, it is quite systematical but a lot of end users are not familiar or understand very well why date perspective should be chosen at the beginning.  And it generates questions on the usage.  Being said, it is simple to sequentially select these fields one by one, it does not cognitively accept by end user of this sequence.  It, thus, becomes difficult to user and understand.

It has been a while for the issue until a feedback comes in.


Feedback and Analysis

Recently, it was heard a feedback to change the sequence to below:

1. Analysis Perspective to select the date range

2. Date Perspective to select the date granularity

3. Unique Date to select the date for analysis

4. Comparison period to select the date range for comparison.  

Ah.....it brainstorms that end user starts analysis not from date granularity but analysis perspective, e.g Actual, YTD, Rolling 6 months, etc.  With this idea, the below are popped up to revisit:

1. Is it possible to remove date perspective but can maintain the relationship against Unique Date?

2. Is it possible to apply this sequence flow?

3. Can the analytical calendar be simpler?


As a result, a solution is out to try to address this.  Let's see what it does and how can solve this.


Analysis Perspective merges with Date Perspective

Let's first review what is included in the Date Perspective and Analysis Perspective.  In short, one is for date granularity and one is for the date period range.


It is always being said that it was inconvenient because of the date perspective.  It can be understood that human does not deal with this explicitly in daily life.  More often, it is used unconsciously without user cognition.  So, in particular to this, an attempt is made to a closer look to into the date perspective and analysis perspective.

It is found that to some extent, Analysis Perspective also includes the ingredient of date granularity, e.g. Rolling 2 Years, Year to Quarter, etc.  All these ranges have date granularity but just "Actual" is not.  So, the below is tried to merge the date perspective into the analysis perspective.


The major changes, in fact, to the Analysis Perspective is on the "Actual".  Now, it becomes "Actual Year", "Actual Quarter", "Actual Month", "Actual Week" and "Actual Date".  It breaks exactly which Actual Date granularity.


As a result, there are only now three fields required now and date perspective can be removed.

1. Analysis Perspective

2. Unique Date

3. Comparison Perspective

Does it look better and easier now?  Yes, it was also heard Unique Date is not easy to interpret but do you have any suggestion for a better term?  I think from meaning-wise, unqiue date is the most suitable.


Model Simplification

Along with the attempt to simplify the selection processes and fields required, there is also attempt to simplify the data model to let everyone easier to manipulate the analytical calendar.

The below is the simplified data model.


The changes include:

1. Remove Custom Date comparison.  It creates complicated data model and the use case is less occurred.

2. Combined Analysis Calendar and Comparison Calendar into Analytical Calendar.

As a result, only three tables are required.

1. ANALYTICAL_CALENDAR to have all analysis and comparison calendar details.

2. DATE_RANGE_LINKED_TABLE to have all associated dates against the selection in analytical calendar.

3. DIM_CALENDAR to provide dimension values for chart creation.


Is it simple to use and understand now?  What do you think?  Please leave me comments to improve.


Thank you for reading.  I hope it help.  Leave me message if you have any discussion or want to share your views.


Saturday, March 16, 2024

Analytical Calendar - PowerPoint Deck

   Post Index

Analytical Calendar The Story

2024-03-16

Analytical Calendar

Presentation Deck

A Deck helps to explain Analytical Calendar

*A new version will be available on 2024-03-30 


This post is to provide you a deck to help explain about the analytical calendar.  The screen captures are shown below and the corresponding PowerPoint as well as the applications, you can find in below links.


PowerPoint

https://github.com/kongson-cheung/analytical-calendar/blob/main/PowerPoint/AnalyticalCalendar_2024-03-16.pptx


QlikView Example

https://github.com/kongson-cheung/analytical-calendar/blob/main/QlikView%20Analytical%20Calendar%20Examples/AnalyticalCalendar5.4.qvf


PowerBI Example

https://github.com/kongson-cheung/analytical-calendar/blob/main/PowerBI%20Analytical%20Calendar%20Examples/AnalyticalCalendar5.4.pbix


Qlik Sense Example

https://github.com/kongson-cheung/analytical-calendar/blob/main/Qlik%20Sense%20Analytical%20Calendar%20Examples/Analytical%20Calendar%205.0_Complete_Week_With_Custom.qvf

* Qlik Sense Example, I have got some issue in my Qlik Sense Desktop.  You might refer to old version at the moment.


The presentation slides:


Thank you for reading.  I hope it help.  Leave me message if you have any discussion or want to share your views.