Saturday, May 25, 2024

Tableau - Analytical Calendar Attempt

 Post Index

Analytical Calendar The Story

2024-05-25

Analytical Calendar

Applying in Tableau

How to implement in Tableau

This post is to provide you an idea how to implement Analytical Calendar in Tableau.  Or more directly, it is how I try to put the Analytical Calendar into Tableau for an attempt so that Tableau can also enjoy the simplicity of the analysis and comparison periods as well as the simplified selections to navigate with the time.

In order to implement Analytical Calendar is not straightforward.  It cannot direct plug in and use.   And a few tuning is required and it also requires to understand deeper of Tableau.

In the following, I will share what I have encountered and what I have done.  Let's start!


Differences in Tableau

First of all, the design of tableau is quite different from Power BI and Qlik.  The major difference is that it is query-based.  What it means is that any data required from the data sources, it triggers a query.  It uses joins regarding to the data model.  No matter it is a filter, a measure calculation, etc, it has its own mechanism to get data from the data sources.  Even if it is using Extract, it is still query-based.

This means for Analytical Calendar, it requires a way to facilitate a fast way to retrieve data such that it can reduce the time and resource require to link up the required period data.

Another headache difference is that Tableau is unable to override filters.   Once it has been configured in the worksheet, it does not have any methods to override the filter values.   Tableau has a hierarchy of filtering from Extract, Data Source, Context, Dimension, Measure to Table as illustrated below.

https://www.thedataschool.co.uk/tristan-kelly/different-types-of-filters/


Although you might find LOD to help but it can only ignore dimension in the worksheet dataset.  As a result, it is not freely for you to control "N/A" or the Comparison Perspective as what you want.


New Design to Adapt Tableau

With the limitations or the differences in Tableau, the Analytical Calendar design has to be updated and make a bit different compared to Power BI and Qlik in order to adapt to Tableau.

In the latest version of Analytical Calendar, only three elements are required to be selected including Analysis Perspective, Unique Date and Comparison Perspective and in measures, we did the trick to modify the Comparison Perspective to "N/A" in order to make an analysis period selection.  However, Tableau isn't able to achieve the same.

In Tableau Analytical Calendar design, the three fields are remained but the selection of these three fields are not directly as what you selected.  Instead, each pair of selection will associate together with both Analysis Period and Comparison Period.  This is to overcome the filter limitation in Tableau.  Such that, in the worksheet, you are able to control to show the Analysis Period or the Comparison Period by the additional field called Calendar Control.

The below diagram illustrated an example of the design:


In the example, You are looking for 2024-05-20 (Actual Date) to compare 1 day before.  This selection, in the data model, is associating with two Date Range Key, i.e. Analysis Period and Comparison Period.  In tableau measures, it can control to use Calendar Control = 'ANALYSIS' for analysis period while Calendar Control = 'COMPARISON; for comparison period.  Although it increases the number of rows, because we are only a limited combinations of selection of the Analytical Calendar three core fields, it greatly narrows down the required rows in joining.  Overall, only a little resource is required to compensate the Tableau design limitation.


Tableau Analytical Calendar Template

I have also put the Tableau template in https://github.com/kongson-cheung/analytical-calendar/blob/main/Tableau%20Analytical%20Calendar%20Examples/AnalyticalCalendar6.0_Tableau.twbx.

Please have a try and let me know your comment.


Below are the screen captures of the template.  It does not have nice visual as the focus is to show the usage of Analytical Calendar.

The same layout is developed in Tableau similar to Qlik and Power BI.

The beauty of Analytical Calendar is that you are free to travel with time on analysis period and its comparison period.  Single presentation can already satisfy YoY, MoM, YTD, etc.


Thank you for reading.  I hope it help.  Leave me message if you have any discussion or want to share your views.


Sunday, May 5, 2024

Qlik Sense Penalty Card

 Post Index

2024-05-05

Qlik Sense Penalty Card

Share Knowledge Share Fun

Performance Tips in Qlik Sense


First of all, thank you for our team to put their effort and passion in developing the cards with fun, with heart and with the knowledge to share about the Qlik Sense best practices.  


You might know some of them but let's see if you know them all.  Performance, in fact, is $$$.  With better performance, the usage of CPU, RAM, Network and Disk is dropped and in the clod era, it saves your pocket.  Take the card wisely and most importantly, have fun with them.


The original post can be found in the Qlik Sense Community.

https://community.qlik.com/t5/New-to-Qlik-Analytics/Qlik-Sense-Penalty-Card/m-p/2448393#M250926

The cards are not perfect but we have put our passion into it.  So, enjoy the cards and have fun together.  Kindly share your views with us and let's continue with it.  Learning should be interesting and fun.

And you can find the penalty cards below.  How much do you know already?


Alteryx Penalty Card

Post Index

2024-05-05

Alteryx Penalty Card

Share Knowledge Share Fun

Performance Tips while using Alteryx Designer


Saturday, April 20, 2024

Analytical Calendar in Google Drive

 Post Index

Analytical Calendar The Story

2024-04-20

Analytical Calendar in Google Drive

Data File Sharing and How to Use

Analytical Calendar (Default Mode) from 2015 to 2024


This post is to provide you a step by step guide on how to integrate the analytical calendar into your analytic dashboard.  The analytical calendar files are now available in Google Drive (Please send me a request and I will share you the files).

The Analytical Calendar consists of the following information:

1. It has calendar information from 2015-01-01 to 2024-12-31.

2. It has date granularity of Year, Quarter, Month, Week and Date.

3. Week is using Complete Week concept.

4. Analysis Perspective include:

    a) For Year

        i) Actual Year

        ii) Rolling 2, 3 Years

    b) For Quarter

        i) Actual Quarter

        ii) Year to Quarter

        iii) Rolling 2, 3 Quarters

    c) For Month

        i) Actual Month

        ii) Year to Month

        iii) Rolling 2 - 11 Months

    d) For Week

        i) Actual Week

        ii) Year to Week

        iii) Rolling 2 - 26 Weeks

    e) For Date

        i) Actual Date

        ii) Year to Date

        iii) Year to Month

        iv) Rolling 2 to 30 Days

5. Unique Date include:

    a) Year from 2015 to 2024

    b) Quarter from 2015-Q1 to 2024-Q4

    c) Month from 2015-Jan to 2024-Dec

    d) Week from 2015-W2 to 2024-W53

    e) Date from 2015-01-01 to 2024-12-31

6. Comparison Perspective include:

    a) N/A

    b) For Year

        i) From 1 to 3 Years before

    c) For Quarter

        i) From 1 to 3 Years before

        ii) From 1 to 3 Quarters before

    d) For Month

        i) From 1 to 3 Years before

        ii) From 1 to 3 Quarters before

        iii) From 1 to 11 Months before

    e) For Week

        i) From 1 to 3 Years before

        ii) From 1 to 26 Weeks before

    f) For Date

        i) From 1 to 3 Years before

        ii) From 1 to 3 Quarters before

        iii) From 1 to 11 Months before

        iv) From 1 to 26 Weeks before

        v) From 1 to 30 Days before

7. It might have more than required calendar information and that can be filtered.  It will be demonstrated how to do.


Step by Step Guide

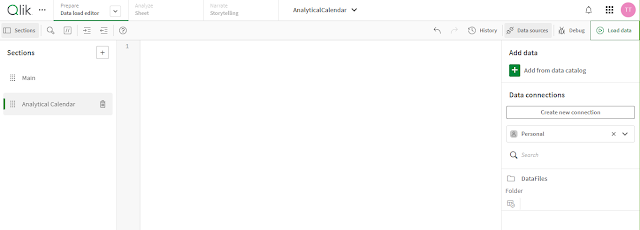
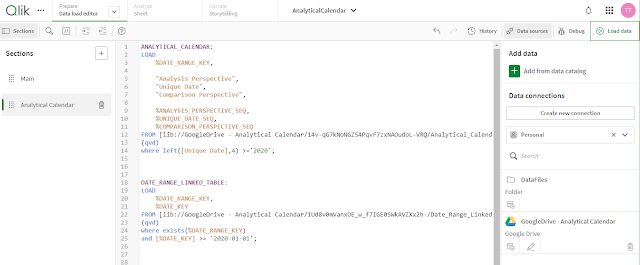
In Qlik SaaS, create a new application or use the application that you would like to use the Analytical Calendar.  And then go to Data Load Editor to begin.


1. Click "Create New Connection".


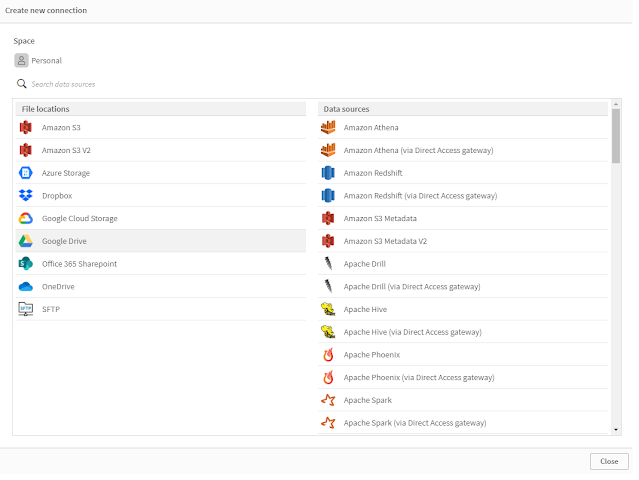
2. Click "Google Drive".

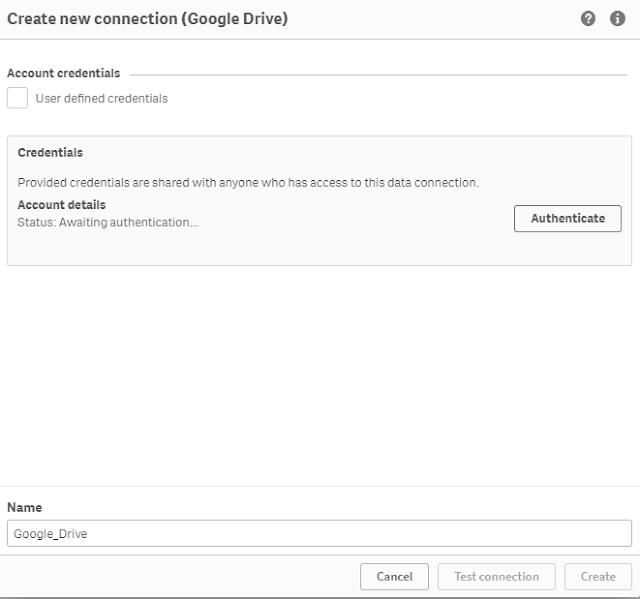
3. Click "Authenticate".


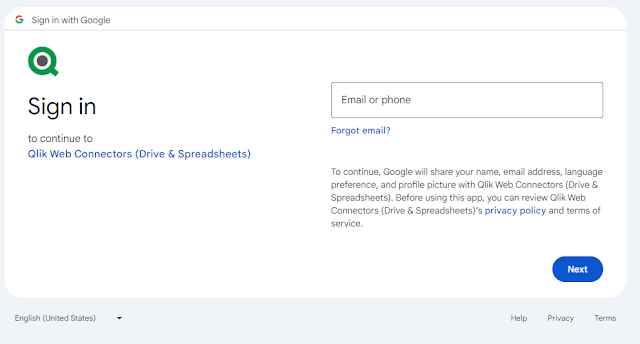
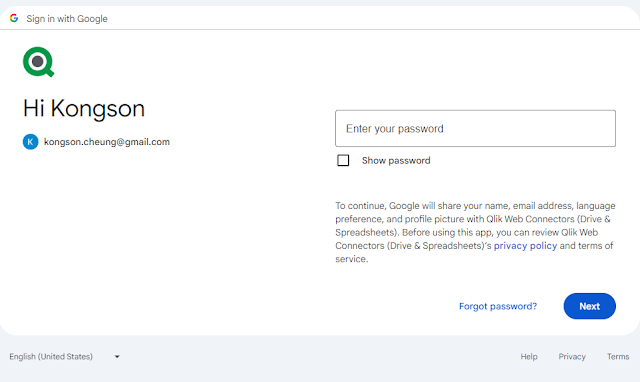
4. Enter the Gmail account.


5. Enter the password.


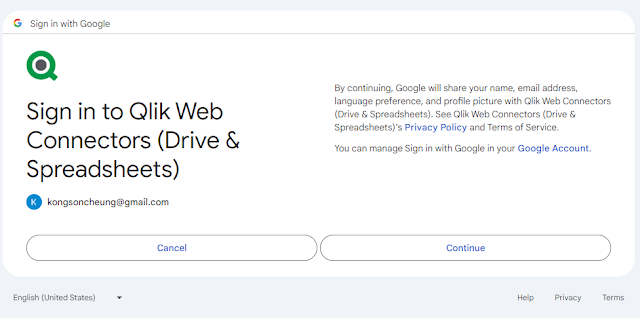
6. Click "Continue".


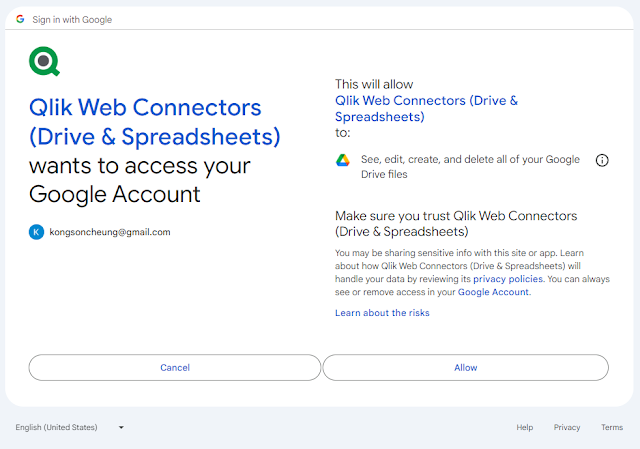
7. Click "Allow".


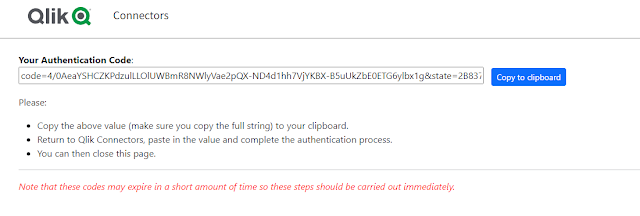
8. Click "Copy to Clipboard".


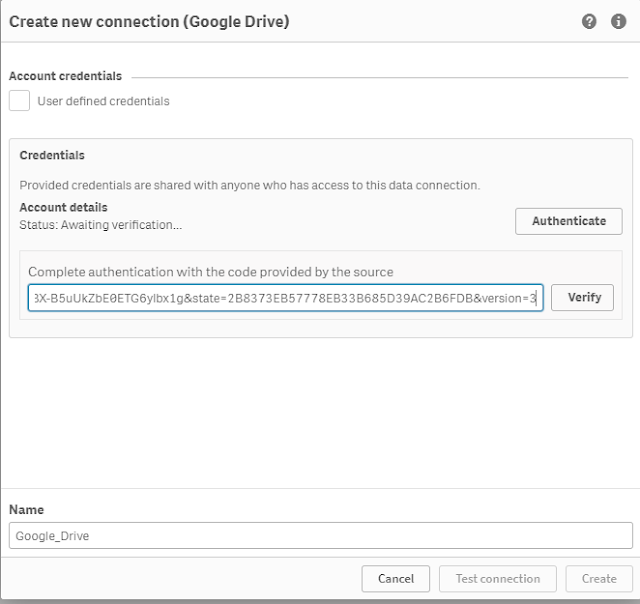
9. Paste the link and click "Verify".


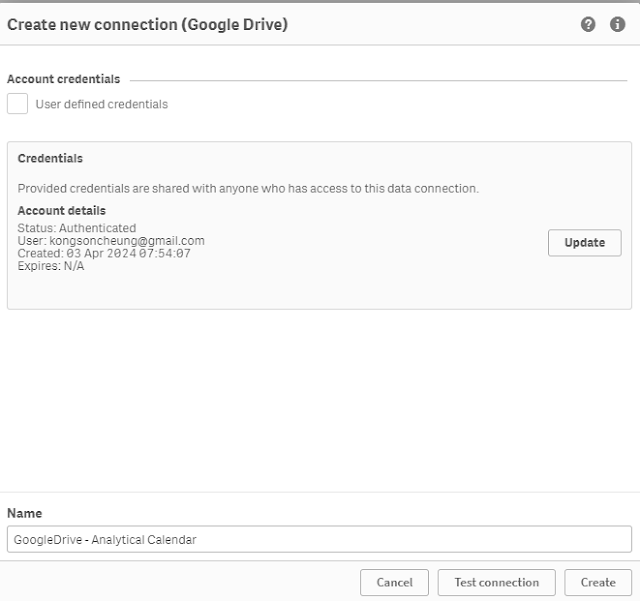
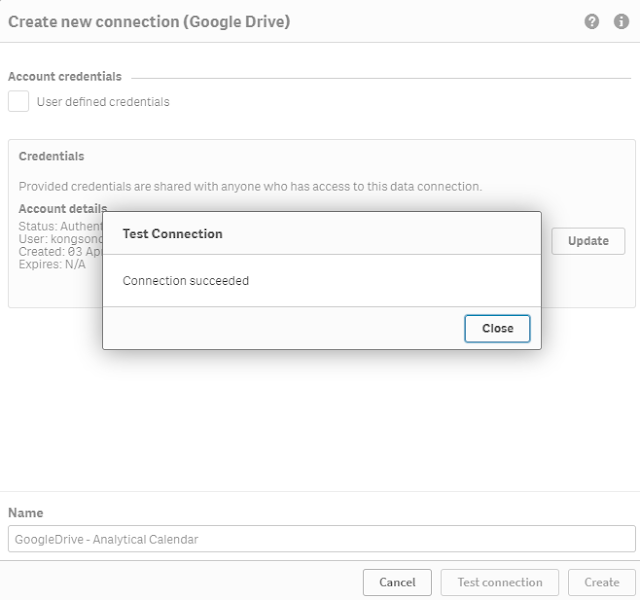
10. Update the Name and click "Test Connection".


11. Click "Close".


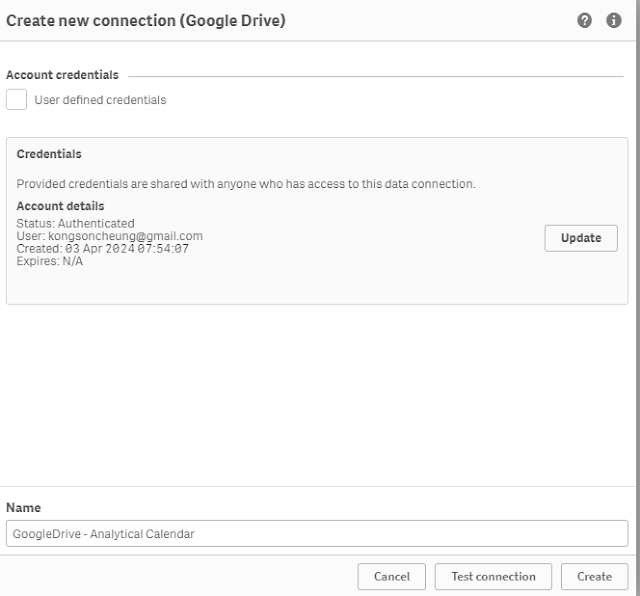
12. Click "Create".


13. Click the folder icon under the newly created connection.


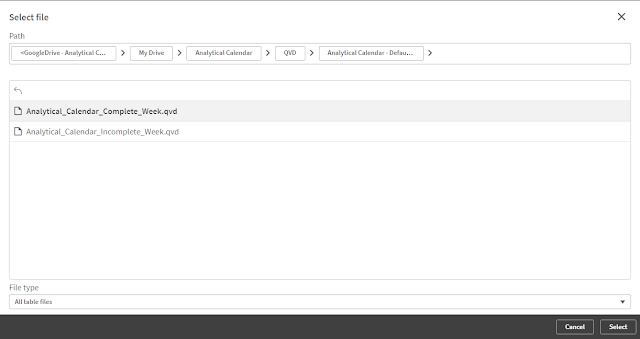
14. Select the Analytical Calendar file and click "Select".


15. Wait.

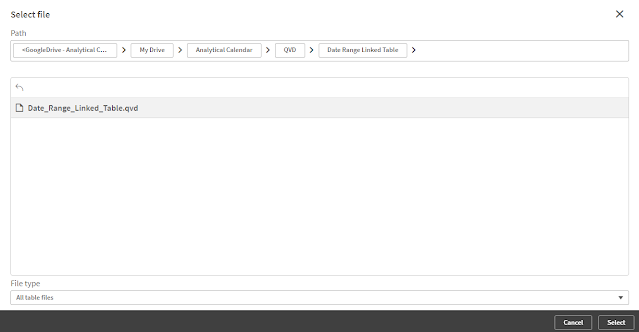
16. Do the same for Date Range Linked Table.  Select the file and click "Select". 


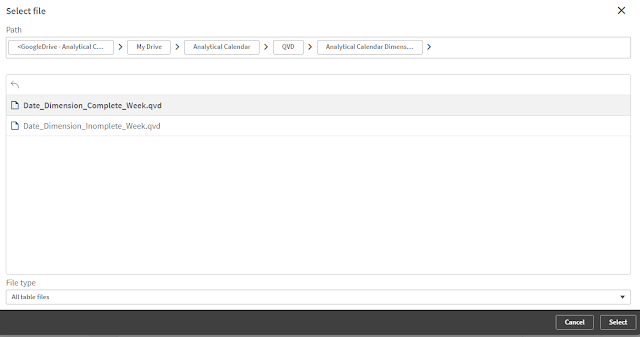
17. Do the same for Date Dimension.  Select the file and click "Select". 


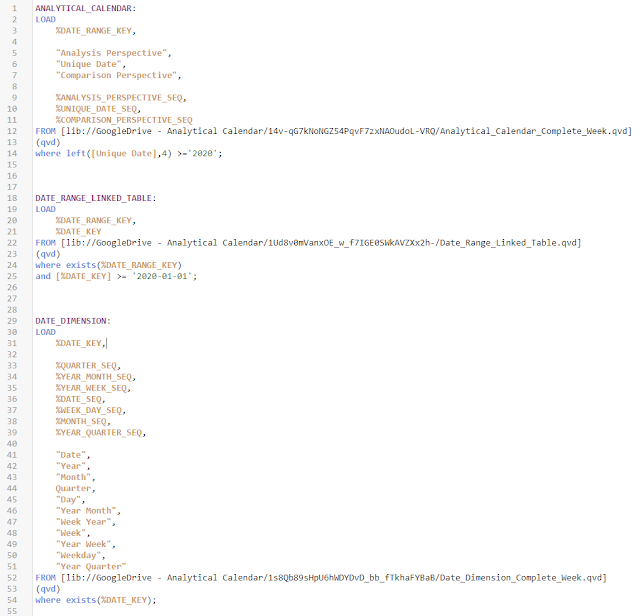
18. Modify the script.

a) Add the Table Name.

b) In ANALYTICAL_CALENDAR, add the where clause 

    Where left([Unique Date], 4) >= 'YYYY' (YYYY is between 2015 to 2024)

c) In DATE_RANGE_LINKED_TABLE, add the where clause 

    Where exists(%DATE_RANGE_KEY)

    and [%DATE_KEY] >= 'YYYY-MM-DD' (YYYY-MM-DD is between 2015-01-01 to 2024-12-31)

d) In DATE_DIMENSION, add the where clause 

    Where exists(%DATE_KEY)

All these will eliminate the unnecessary data.


19.  Click "Load Data".


20. Enjoy using the Analytical Calendar !!


Conclusion

It is a no cost sharing.  Very Simple and can let you enjoy the advantages of the Analytical Calendar.   The settings are default and definitely can be customized for specific usage.  If there is a demand, it would later enhance the overall distribution method to really help contribute to the Analytics realm.  For the time being, have a try and let me know if you have any feedback.  The calendar has been developing for quite some time and keep evolving based on the your comments.


Thank you!!  I hope you enjoy the reading and sharing.


Saturday, March 30, 2024